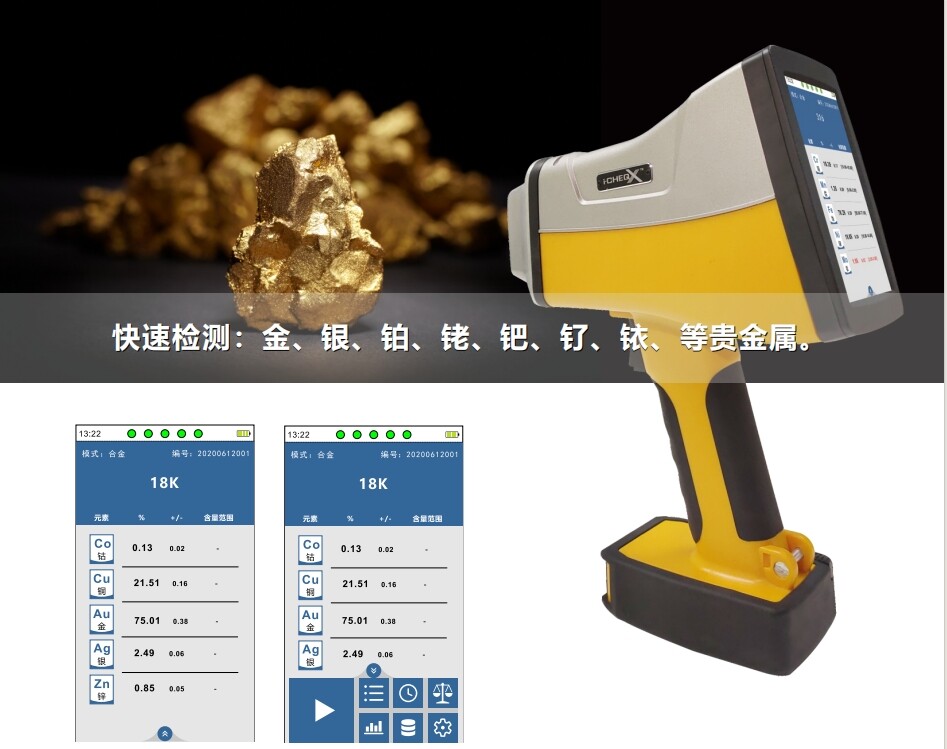
X - ray Fluorescence Spectrometer (XRF) realizes qualitative and quantitative analysis of elemental composition by detecting the energy or wavelength of characteristic X - rays released after the sample is excited. The following are the core differences between the two and practical application cases:
I. Core Differences between Qualitative Analysis and Quantitative Analysis
| Dimension | Qualitative Analysis | Quantitative Analysis |
|---|
| Objective | Determine the types of elements present in the sample | Measure the specific content (%) or concentration (ppm) of each element |
| Technical Dependence | Rely on the matching of the elemental characteristic spectral line database (such as K╬▒, L╬▓ lines) 1 71 | Require the establishment of standard curves or mathematical models (such as matrix effect correction, internal standard method) 10 41 |
| Data Output | List of element types (such as Ni, Cr, Mo) | Numerical values of element content (such as Cu content 58.2% ┬▒ 0.3%) |
| Application Scenarios | Rapid sorting, grade identification, impurity screening | Quality control, scientific research - level precision requirements, trade compliance testing |
| Error Sources | Spectral line overlap (such as Co K╬▒ and Fe K╬▓) 33 | Matrix effects, sample homogeneity, standard curve deviation 80 |
II. Comparison of Technical CharacteristicsQualitative Analysis Characteristics
Fast Speed: Completes detection in 2 - 3 seconds, suitable for on - site rapid screening (such as scrap metal sorting).
Non - destructive: No need to cut the sample, and can directly analyze solids, powders, and liquids.
Limitations: Unable to distinguish element forms (such as Fe┬▓Ôü║ and Fe┬│Ôü║), and has low sensitivity to light elements (such as Be, B).
Quantitative Analysis Characteristics
High Precision: The error of EDXRF is about 5 - 10%, and that of WDXRF can reach 0.1%.
Complexity: Requires strict sample preparation (such as grinding, tablet pressing), calibration curve establishment, and interference correction.
High Cost: Laboratory - grade equipment (such as WDXRF) is dozens of times more expensive than handheld devices.
III. Practical Case AnalysisCase 1: Qualitative Sorting in Scrap Metal Recycling
Scene: A recycling station receives mixed copper alloy waste materials (such as brass, bronze) and needs to quickly distinguish the material types.
Technical Application: Use a handheld XRF (EDXRF) for scanning. Distinguish brass (Zn 30 - 40%) from pure copper (CuÔëą99.9%) through the Cu - Zn characteristic spectral lines to avoid misjudgment that may lead to excessive impurities in smelting.
Result: The sorting efficiency is increased by 80%, and the impurity rate of the furnace is reduced from 5% to 0.8%.
Case 2: Quantitative Detection of Trace Elements in Copper Ore
Challenge: The content of Co and Ni in copper ore fluctuates greatly (0.01 - 1%), and traditional methods have high errors.
Technical Solution: Adopt WDXRF combined with the variational mode decomposition algorithm to deduct the spectral background interference, establish an SVR model to predict the Cu content, and the determination coefficient (R┬▓) is increased from 0.85 to 0.92.
Value: The utilization rate of mine resources is increased by 15%, reducing waste in ore dressing.
Case 3: Verification of the Purity of Precious Metal Jewelry
Demand: Detect whether the Au content in gold jewelry reaches 99.9% (the standard for thousand - pure gold).
Method: Use a desktop XRF (ScopeX® GOLD) for quantitative analysis. Compare the intensity of the Au Lα line with the standard curve, and the detection limit reaches 0.01%.
Application Effect: Identify that the base material under the gold - plated layer (0.1╬╝m) is brass, avoiding the high - price recycling of fakes.
Case 4: Analysis of the Plating Thickness of Electronic Components
Problem: Uneven nickel - plating thickness on the circuit board leads to poor soldering.
Technology: Use micro - beam XRF (focusing capillary lens) for surface scanning to quantitatively analyze the thickness of the Ni layer (with an accuracy of ┬▒0.05╬╝m).
Achievement: After optimizing the electroplating process, the yield rate is increased from 78% to 95%.
IV. Selection Suggestions
Prioritize Qualitative Analysis: When it is necessary to quickly judge the existence of elements (such as waste material sorting, identification of archaeological relic materials).
Must Use Quantitative Analysis: When it involves trade settlement (such as ore pricing), process control (such as alloy composition optimization).
Mixed Strategy: Use handheld XRF for initial screening laboratory WDXRF for precise measurement, taking into account both efficiency and accuracy.


